Weekly Market Outlook January 19th 2025
Jan 19, 2025
Weekly Trader's Outlook
Stocks Rally, Yields Drop, Fueled by Benign Inflation Data
January 17, 2025 | Joe Casey
Stocks on the Rise
This week marked the best gains for stocks since November, with the S&P 500 surging by 3.0% as bond yields eased after cooler-than-expected inflation reports. Despite increased volatility earlier in the week, a sense of relief drove the rally, though inflation concerns remain.
The Week in Review
Last week, I predicted heightened volatility and a slightly bearish tone. While volatility did increase—the VIX hit a year-to-date high of 22 on Monday—the markets surprised with a significant bounce. The S&P 500's rally followed weaker-than-expected CPI and PPI inflation data, pushing bond yields lower and encouraging bullish sentiment.
Key Market Drivers This Week:
- Relief Rally: After last week’s ISM Services Prices Index reading (64.4 in December vs. 58.2 in November) stoked inflation fears, this week's cooler inflation data sparked optimism.
- Strong Earnings Reports: Major banks' Q4 results boosted investor confidence in corporate earnings growth for 2025, with FactSet forecasting 14.8% annual EPS growth.
Looking Ahead to Next Week
Despite the bullish momentum, caution is warranted. A light economic calendar places the spotlight on Q4 earnings reports and potential policy shifts from the incoming Trump administration.
Potential Catalysts to Watch:
- Tariffs: Any announcements could pressure stocks early in the week.
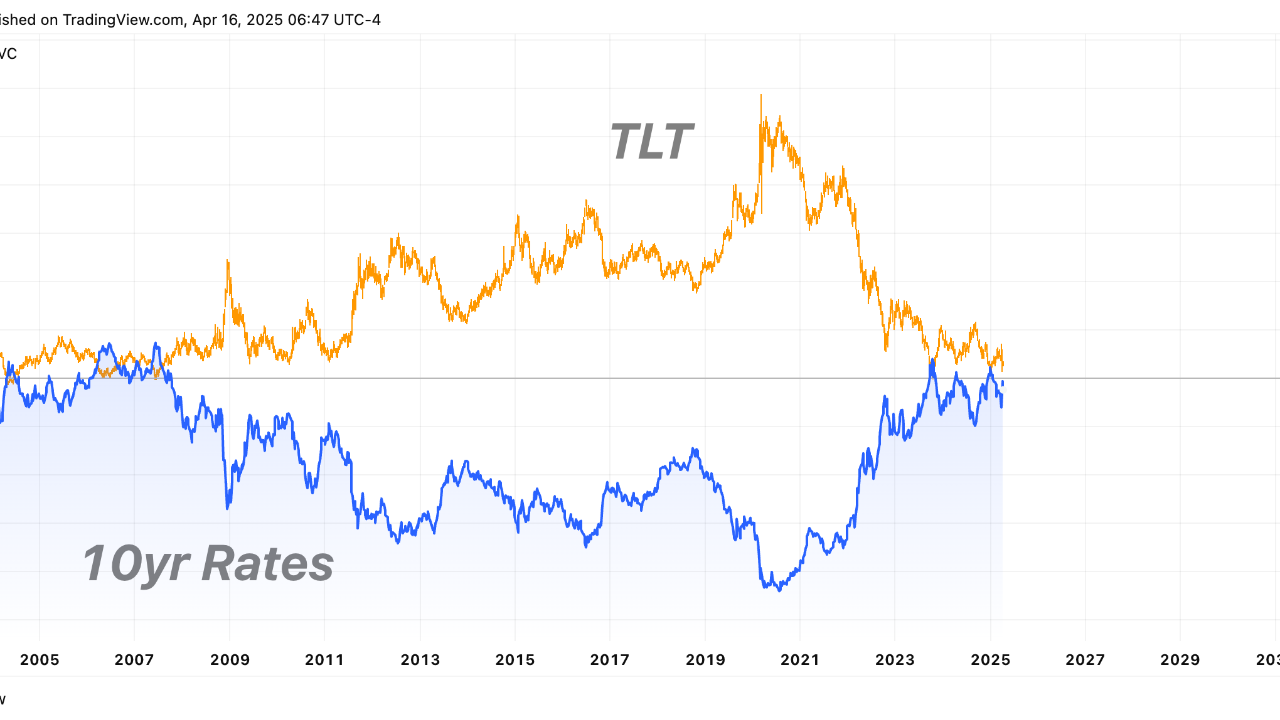
- Bond Yields: A further drop may sustain bullish momentum, while a rise could weigh on stocks.
- Technical Setup: Near-term overbought conditions suggest a possible pullback.
Forecast: Slightly bearish. Mean reversion often plays out, especially after a strong rally.
Economic Calendar
Monday (1/20): No reports
Tuesday (1/21): Earnings from Netflix, Charles Schwab, and United Airlines
Wednesday (1/22): Housing and mortgage data
Thursday (1/23): Weekly jobless claims, natural gas inventories
Friday (1/24): Existing home sales and consumer sentiment
Key Inflation Data
- CPI: Headline CPI rose 0.4% MoM (+2.9% YoY), driven by shelter costs (+4.6% YoY).
- PPI: Lower-than-expected increases (+0.2% MoM headline, flat core) provided further reassurance.
- Retail Sales: Core retail sales rose 0.4% in December, reflecting steady consumer spending.
- Treasury Yields: The 10-year yield dropped ~17 basis points, easing pressure on equities.
Technical Take
S&P 500 Index
The S&P 500 rebounded off its 100-day SMA earlier this week, a bullish signal. It’s now trading above a downward-trending channel established in December. While near-term conditions appear overbought, the longer-term outlook is positive.
Technical Outlook: Slightly bullish.

Russell 2000 Index
The Russell 2000 index bounced off its 200-day SMA, mirroring its supportive trend from August and September last year. Bond yields easing further would provide additional tailwinds.
Technical Outlook: Slightly bullish.

Cryptocurrency Update
Bitcoin surged ~5%, reaching a one-month high of $104,759, following news of President-elect Trump’s plans to prioritize crypto policies, including forming an advisory council. This announcement coincides with tonight’s "Inaugural Crypto Ball."
Market Breadth
An improvement in market breadth suggests healthier investor sentiment. The percentage of stocks trading above their 200-day SMA increased for the week:
- S&P 500: 60.8% (up from 55.8%)
- Nasdaq Composite: 46.4% (up from 45.8%)
- Russell 2000: 52.3% (up from 49.9%)
Source: Bloomberg L.P.
(Insert a breadth chart showing week-over-week SMA data for indices.)
Notable Highs and Lows
- 52-Week Highs: Citigroup (C), NRG Energy (NRG), Whirlpool (WHR)
- 52-Week Lows: Biogen (BIIB), Dollar General (DG), Hershey Foods (HSY)
Conclusion
This week’s rally underscores the importance of staying nimble and informed. As inflation data evolves and Q4 earnings continue to roll in, the market’s direction will hinge on bond yields and policy developments. Remember: "Mean reversion is real." Stay prepared for shifts and opportunities.